Spark安裝

請先安裝好Hadoop~~

下載Spark,解壓,換名字

cd /home/hadoop
wget http://apache.stu.edu.tw/spark/spark-2.4.1/spark-2.4.1-bin-hadoop2.7.tgz
tar -xvf spark-2.4.1-bin-hadoop2.7.tgz
mv spark-2.4.1-bin-hadoop2.7 spark

export HADOOP_CONF_DIR=/home/hadoop/hadoop/etc/hadoop
export SPARK_HOME=/home/hadoop/spark
export LD_LIBRARY_PATH=/home/hadoop/hadoop/lib/native:$LD_LIBRARY_PATH

(續…)


如何安裝Hadoop – 以Hadoop3.1.2為例

安裝好Fedora後(詳見這篇),接著要安裝Hadoop

首先,連到網頁下載Hadoop binary的網址

在fedora下指令:

wget http://apache.stu.edu.tw/hadoop/common/hadoop-3.1.2/hadoop-3.1.2.tar.gz

等待下載完成

並解壓縮:

tar vzxf hadoop-3.1.2.tar.gz

然後參考https://hadoop.apache.org/docs/r3.1.2/hadoop-project-dist/hadoop-common/SingleCluster.html

進行設定與操作

安裝JAVA

sudo dnf install java-11-openjdk

設定PATH

在下指令:

bin/hadoop

來確認可以使用


Hadoop Cluster 測試 – HDFS

在各Node上,必須先確認其IP與hostname

可下指令修改hostname

sudo hostnamectl set-hostname vm1

再利用指令尋找Node的IP

ip addr

如下圖已修改hostname為vm1,且得知IP為 192.168.56.102


將IP位置與命名加入各node的/etc/hosts檔案中

在各個node加入名為hadoop的使用者,並設定密碼

sudo -u root useradd hadoop

sudo -u root passwd hadoop

以hadoop使用者登入主要的node,並建立ssh key

ssh-keygen -t rsa (一路ENTER下去)

再把ssh key送到各個node上

ssh-copy-id hadoop@vm0

ssh-copy-id hadoop@vm1

用hadoop ssh登入vm0,並下載hadoop,解壓,與重新命名binary: http://ftp.tc.edu.tw/pub/Apache/hadoop/common/hadoop-3.1.2/hadoop-3.1.2.tar.gz

wget http://ftp.tc.edu.tw/pub/Apache/hadoop/common/hadoop-3.1.2/hadoop-3.1.2.tar.gz

tar -xzf hadoop-3.1.2.tar.gz

mv hadoop-3.1.2 hadoop

調整JAVA_HOME 至 /usr/lib/jvm/jre

vi hadoop/etc/hadoop/hadoop-env.sh

在各Node設定NameNode (~/hadoop/etc/hadoop/core-site.xml)

vi ~/hadoop/etc/hadoop/core-site.xml

同樣的,設定HDFS Path

設定 yarn

vi ~/hadoop/etc/hadoop/mapred-site.xml

vi ~/hadoop/etc/hadoop/yarn-site.xml

設定workers

vi ~/hadoop/etc/hadoop/workers

設定記憶體相關(DEFAULT值給8G RAM用的)

vi ~/hadoop/etc/hadoop/yarn-site.xml

vi ~/hadoop/etc/hadoop/mapred-site.xml

致此,設定完成

將相關的設定檔案COPY至每個Node

scp hadoop-*.tar.gz vm1:/home/hadoop

SSH連進Node

ssh vm1

解壓,重命名,然後離開

tar -xzf hadoop-3.1.2.tar.gz
mv hadoop-2.8.1 hadoop
exit

for node in node1 node2; do
scp ~/hadoop/etc/hadoop/* $node:/home/hadoop/hadoop/etc/hadoop/;
done

格式化HDFS (在vm0上) hadoop/bin/hdfs namenode -format

然後啟動HDFS

hadoop/sbin/start-dfs.sh

可連上網頁觀看 http://vm0:9870

此至,HDFS設定完成

如何安裝Linux系統 – 以Fedora為例

首先,先到官網選擇適合的ISO,本篇以Fedora 29 Server的DVD ISO為例

接著使用VirtualBox進行安裝與測試 使用2G的ram與8G的硬碟。

設定Nat Network後,進行連結與設定,放入先前抓下來的ISO。按下Start即可開始安裝

選擇 「Install Fedora 29」

出現友善的安裝畫面,選擇English,English(United States) –〉continue

調整Installation Destination,選擇Custom –〉Done

Standard Partition,/boot / swap 空間如圖設定(請盡量用EXT4格式)–〉Done –〉accept change –〉Begin installation


就開始裝了,要同時設定root密碼與建立使用者帳號, 就等待安裝完成吧 –〉Reboot(記得把光碟退掉)

更新指令

sudo dnf update -y

等他完成,就可以開始使用啦!

如何在QGIS 鏈接 PostGIS?

Connect QGIS with PostGIS tutorial

Open QGIS.

Select PostgreSQL icon on the left hand side of QGIS.

A menu name “Add PostGIS table” will appear.

Select “New” to create a connection to PostGIS and enter the “Name”, “Host”, “Port” and “Database”.

After fill up all required data, please select “Connect” to connect PostGIS. Layers that available in database will be shown.


Select layers that you need.

Selected layers will be shown in QGIS.

STAR-BME Example(Taipei PM2.5 )

Taipei PM2.5 Example

1. Set CRS(Coordinate Reference System)
Select WGS84(EPSG:4326) in “Coordinate Reference System Selector”
2. Specify data
Specify Hard data and Soft data in “Specify Data” window
i. Hard data
Select “PM2.5_105_taipei.csv” from downloaded example file under “/data”

After import hard data and soft data. BMEobj will be created,soft data and hard data will be load in QGIS.

Figure2.1

Time View of hard data

Hard data (circle) and is showed. From figure2.1, color bar and time bar of data are showed on the left and below of figure.

3. Compute Trend and Residual From Data
User can choose “No Detrending”, “Kernel Smoothing” or “STmean” in this step. In this example, we will use “STMean”.

4. Covariance Analysis

4.1 Empirical Covariance Estimation
For this case, we will set:
Spatial Distance Limit: 0.1179 Temporal Distance Limit: 11700.0
Number of Spatial Lags:8 Number of Temporal Lags:8
Spatial Lag Tolerance:0.01684 Spatial Temporal Tolerance: 1671.0

And press “Plot Empirical Covariance”.

And press “Plot Empirical Covariance”.

4.2 Covariance Model Fitting
In this case, we will use “Exponential” to fit covariance. After fitting covariance, 2D and 3D Fit covariance will be plotted.
Nest Number = 2
Fit Covariance Model
C1 =1.164, S1 = 0.05624, T1 =3326
C2 = 0.1365, S2 = 0.03682, T2 = 1861

5. Prediction
Specify location: For this case, we use “Grid Input”, which STARBME will generate grid coordinate for predict. Press “Predict” for predict the coordinate that generate by “Grid Input”, we will set coordinate boundary by select “ Set By Data Boundary”
For Grid Input,
Xn = 80
Yn = 80
Tmin = 0, Tmax = 100, Tn = 101
For Predict,
Order = ZeroMean
Spatial Range = 0.05624
Temporal Range = 3326.0
Spatial/Temporal Ratio = 1.691e-05
Nhmax = 5, nsmax = 0

6. Output result
Specify Task for result: Add Result to QGIS.

STAR-BME Example(US Ozone)

US Ozone Example

1. Set CRS(Coordinate Reference System)
Select WGS84(EPSG:4326) in “Coordinate Reference System Selector”
2. Specify data
Specify Hard data and Soft data in “Specify Data” window
i. Hard data
Select “HardData-wgs84.csv” from downloaded example file under “US_TotalOzone_ST\Data\csv”

ii. Soft data
Select “SoftData_gaussian_wgs84.csv” from downloaded example file under “US_TotalOzone_ST\Data\csv”
a. Soft PDF Type:Gaussian.
b. Soft PDF From: Linear

After import hard data and soft data. BMEobj will be created,soft data and hard data will be load in QGIS.

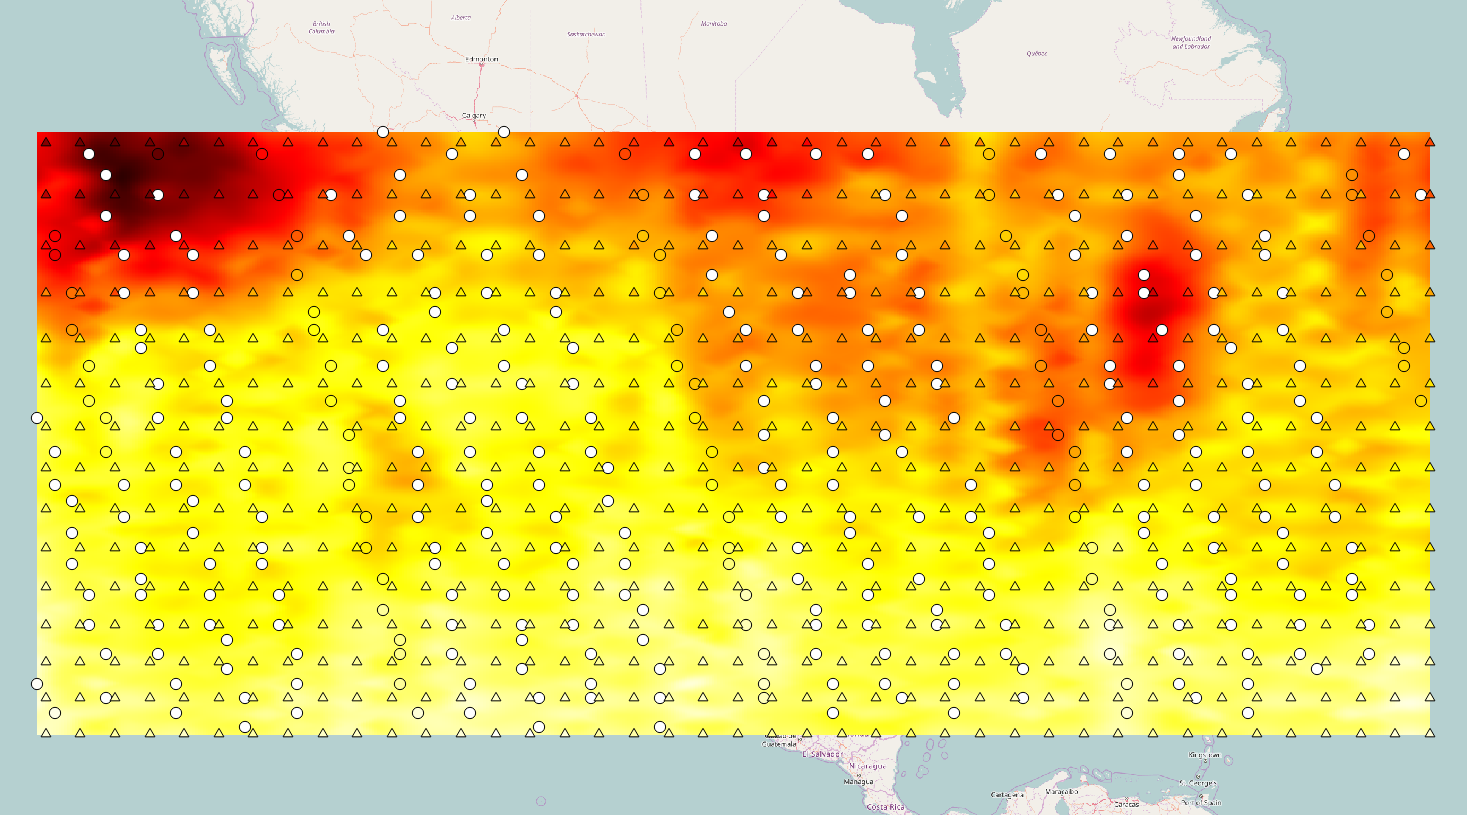
Figure2.1

Time View of hard data

Time View of Soft data

Hard data (circle) and soft data (triangle) are showed. From figure2.1, color bar and time bar of data are showed on the left and below of figure.

3. Compute Trend and Residual From Data
User can choose “No Detrending”, “Kernel Smoothing” or “STmean” in this step. In this example, we will use “No Detrending”.

4. Covariance Analysis

4.1 Empirical Covariance Estimation
For this case, we will set:
Spatial Distance Limit: 71.14 Temporal Distance Limit: 2.667
Number of Spatial Lags:11 Number of Temporal Lags:11
Spatial Lag Tolerance:10.16 Spatial Temporal Tolerance:0.381

And press “Plot Empirical Covariance”.

4.2 Covariance Model Fitting
After fitting covariance, 2D and 3D Fit covariance will be plotted.
Nest Number = 2
Fit Covariance Model
C1 = 59.31, S1 = 7.11,T1 = 0.46
C2 =238.62, S2 = 21.53,T2 = 11.75

5. Prediction
Specify location: For this case, we use “Grid Input”, which STARBME will generate grid coordinate for predict. Press “Predict” for predict the coordinate that generate by “Grid Input”, we will set coordinate boundary by select “ Set By Data Boundary”
For Grid Input,
Xn = 50
Yn = 50
Tn = 5
For Predict,
Order = ZeroMean
Spatial Range = 21.53
Temporal Range = 11.75
Spatial/Temporal Ratio = 1.832
Nhmax = 5, nsmax = 2
Cross Validation
Hard Data only, with sample size = 377

6. Output result
T = 6

T = 7

T = 8

T = 9

T = 10

STAR-BME Example(PM10)

Taipei PM10 Example

1. Set CRS(Coordinate Reference System)
Select WGS84(EPSG:4326) in “Coordinate Reference System Selector”
2. Specify data
Specify Hard data and Soft data in “Specify Data” window
i. Hard data
Select “PM10_105_taipei.csv” from downloaded example file under “/data”

After import hard data and soft data. BMEobj will be created, hard data will be load in QGIS.


Time View of hard data


Hard data (circle) and is showed. From figure2.1, color bar and time bar of data are showed on the left and below of figure.

3. Compute Trend and Residual From Data
User can choose “No Detrending”, “Kernel Smoothing” or “STmean” in this step. In this example, we will use “STMean”.

4. Covariance Analysis

4.1 Empirical Covariance Estimation
For this case, we will set:
Spatial Distance Limit: 0.1179 ,Temporal Distance Limit: 11700.0
Number of Spatial Lags:8, Number of Temporal Lags:8
Spatial Lag Tolerance:0.01684, Spatial Temporal Tolerance: 1671.0

And press “Plot Empirical Covariance”.

4.2 Covariance Model Fitting
In this case, we will use “Exponential” to fit covariance. After fitting covariance, 2D and 3D Fit covariance will be plotted.
Nest Number = 2
Fit Covariance Model
C1 =1.164, S1 = 0.05624, T1 =3326
C2 = 0.1365, S2 = 0.03682, T2 = 1861

5. Prediction
Specify location: For this case, we use “Grid Input”, which STARBME will generate grid coordinate for predict. Press “Predict” for predict the coordinate that generate by “Grid Input”, we will set coordinate boundary by select “ Set By Data Boundary”
For Grid Input,
Xn = 80
Yn = 80
Tmin = 0, Tmax = 100, Tn = 101
For Predict,
Order = ZeroMean
Spatial Range = 0.01
Temporal Range = 3326.0
Spatial/Temporal Ratio = 58500.0
Nhmax = 5, nsmax = 0

6. Output result
Specify Task for result: Add Result to QGIS.

STAR-BME Example(BlackDeath)

BlackDeath Example

1. Set CRS(Coordinate Reference System)
Select WGS84(EPSG:4326) in “Coordinate Reference System Selector”
2. Specify data
Specify Hard data and Soft data in “Specify Data” window
i. Hard data
Select “BD-1-Input-HD.csv” from downloaded example file under “BlackDeath/data/ Harddata”

ii. Soft data
Select “BD-2-SoftLinear.csv” from downloaded example file under “BlackDeath/data/ Harddata”
a. Soft PDF Type:User Defined.
b. Soft PDF From: Linear

After import hard data and soft data. BMEobj will be created,soft data and hard data will be load in QGIS.

Time View of hard data

Time View of Soft data

Hard data (circle) and soft data (triangle) are showed. From figure2.1, color bar and time bar of data are showed on the left and below of figure.

3. Compute Trend and Residual From Data
User can choose “No Detrending”, “Kernel Smoothing” or “STmean” in this step. In this example, we will use “No Detrending”.

4. Covariance Analysis
4.1 Empirical Covariance Estimation
For this case, we will set:
Spatial Distance Limit: 0.5, Temporal Distance Limit: 31.33
Number of Spatial Lags:11 ,Number of Temporal Lags:11
Spatial Lag Tolerance:0.03 ,Spatial Temporal Tolerance:4.476

And press “Plot Empirical Covariance”.

4.2 Covariance Model Fitting
After fitting covariance, 2D and 3D Fit covariance will be plotted.
Nest Number = 2
Fit Covariance Model
C1 = 2.98, S1 = 2.5, T1 = 8.08
C2 = 2.02, S2 = 0.19, T2 = 7.74

5. Prediction
Specify location: For this case, we use “Grid Input”, which STARBME will generate grid coordinate for predict. Press “Predict” for predict the coordinate that generate by “Grid Input” , we will set coordinate boundary by select “ Set By Data Boundary”
For Grid Input,
Xn = 50
Yn = 50
Tn = 5
For Predict,
Order = ZeroMean
Spatial Range = 8.08
Temporal Range = 7.74
Spatial/Temporal Ratio = 1.04392
Nhmax = 5, nsmax = 2

6. Output result
Specify Task for result: Add Result to QGIS(Raster with Mask), with select countries.shp from BlackDeath\Background_shp.